
Introduction to Tokio Tracing and OpenTelemetry
- Ivan Brko
- Jan 13, 2024
- 8 min read
This is the first post in the Rust/Tokio/Tracing/OTEL tutorial series.
As noted in the Introduction post, the purpose of this tutorial is not to provide a strong theoretical background in OpenTelemetry but to provide an easy way to start leveraging some of its features with Rust, so make sure to consult other resources to learn more about the topics we discuss here.
OpenTelemetry tracing - TLDR
Note: The purpose of this paragraph is not to give a detailed explanation of tracing with OpenTelemetry, but rather to establish a simple mental model of what that tracing is and how and why to use it.
Tracing with OpenTelemetry allows us to easily inspect the execution flow of a request processed by our microservice(s).
As can be seen in the following image (downloaded from awesomeopensource.com), when we export traces from our microservice(s), we can use some trace explorer tool (like Jaeger) to inspect the flow of the entire request handling across all our microservices, investigate which parts of the code are slow, find the parts that are failing, etc.

In the second part of this tutorial we'll export the traces to Jaeger, and in the last part we'll export them to GCP Trace Explorer.

What does it mean to instrument some part of the code?
When thinking about the code of our web application, we can think of it as a series of steps we have to do to handle the request we received.
For example:
authenticate/authorize the user making the request
validate the request
transform the data in some way
store the new data in the database
return an OK response to the caller
Some of these steps need to be done sequentially (we don't want to store anything in the database before authenticating the caller and validating the request), some may be done in parallel (if there are no side-effects during transformation, we can start transforming the data even before validating the request and then wait for the validation before persisting to the DB).
Note that you are hopefully already doing a similar division of your logic into discrete steps using - functions! We can actually think of those steps in terms of function calls:
call authenticate()
call authorize()
call validate_request() in one Future and tranform_data() in parallel in another Future
join both Futures from the following step and call persist_data()
call return_ok_response()
Instrumenting our code simply means dividing it into a series of steps, just like in the bullet points provided above, and providing meaningful information for each step (name of the step, id of the request being processed, id of the user making the request, etc). We then export all that data to some Trace Explorer where we can analyse them easily.
When we want to export the persist_data() function we mentioned as a separate step to our Trace Explorer, we say we want to instrument the persist_data function (or instrument the storing logic, however you prefer).
How does OTEL trace exporting work?
At this point, the following is a good mental model to have of how OTEL tracing works, even though it’s not exactly how it's implemented - the exact implementation also depends on where exactly we're exporting the data.
We’ll use the example of the persist_data() function as described in the previous paragraph:
we enter the persist_data() function
we instrumented this function (using some Rust library, more on that later), so we remember the timestamp when we entered
we call our DB and store the record
we exit the persist_data() function
as we instrumented this function, now that it has finished executing we export the following data to our trace collector:
Understanding the data that we send to the Trace Collector
Let’s unpack the structure we just provided:
trace_id → when we start handling one request, we assign a random Trace ID to it and propagate this ID in all the steps of our code that handles this request. This Trace ID is how our Trace explorer knows which traces belong to the same request. Even if we have multiple microservices handling the same request, we want to propagate this Trace ID to all of them (more on how to do that later)
span_id → when we enter a new instrumented step in our code (for example when we enter persist_data()), we’re actually creating a new OTEL span and assigning a random Span ID to this span. This ID is used by our Trace Collector to know when we entered and when we exited this step/span (name of the span - persist_data- is not unique on its own as we could enter this function multiple times in the same request)
parent_span_id → if you go back to the Jaeger/GCP screenshots we provided earlier in the post, you’ll notice that spans (steps) are nested. This makes sense if you think about it, your function transform_data() calls persist_data(), so if we instrument both, transform_data is the parent step of the persist_data step. Parent Span ID then is just the Span ID of your parent span (and if it’s empty, it means that the current span is the root span, first in the execution flow)
timestamp_start → timestamp of when we entered this span
timestamp_end → timestamp of when we exited the span
name → name of the instrumented part of the code, which will be shown in our Trace Explorer (notice that for us in this example it’s just the name of the function, but this is not necessary the case, OTEL span doesn’t have to correspond to a function call)
additional_data → we can export any additional data we want that that we might find useful when inspecting traces, for example, id of the logged in user that’s making the request, HTTP status code we’re returning if we’re already at the point of execution where we know that, etc.
OTEL Context propagation
If you go back to the description of trace_id in the previous paragraph, we said that it is propagated between different microservices when handling the same request. How exactly does this happen?
When these microservices communicate using REST (as they will in our example), context is propagated in the HTTP headers. There are different formats used to store these values in the header, but we’ll focus solely on W3C Trace Context standard, which is the most popular one.
For example, if our microservice receives a request with the header traceparent (that is the expected name of the header with W3C Trace Context standard) set to 00-f6613a397e4db26631df78bf28d94974-e075ac2678ca9eb6-01 this means that:
version of the header is 00 (current last version as of writing this)
trace_id is f6613a397e4db26631df78bf28d94974
parent_span_id is e075ac2678ca9eb6 (we want the first span we open in our application to be the child span of the span that called our microservice, so that it’s all nicely nested in the Trace Explorer)
01 at the end means that the request is recorded/sampled. We will not go into great detail about sampling, all you need to know is that tracing every request in the application is too expensive, so the first microservice that handles the request usually decides randomly to record it or not, and propagates this information in the OTEL context. This way, if a request is traced, it is traced across all the microservices, and if it is not traced, it is not traced by any microservice (although each microservice can configure their own behaviour regardless of what the previous microservice decided, more on that later)
Rust Tracing Crate
Rust has a popular crate used for logging with asynchronous applications, called Tracing. This crate is maintained by the Tokio team, that's why sometimes in the tutorial it is called Tokio Tracing. I will not explain how the Tracing crate works in great detail, there’s a lot of good resources available already (starting with the official documentation), but here’s a brief overview of the components.
Core Tracing Crate
Core Tracing crate allows us to open spans and write log entries. spans are actually quite similar to the OTEL spans we discussed earlier. We open a span, give it some metadata and this metadata will be applied to all the logs that happen inside this span. Note that with the Tracing Crate, unlike with OTEL spans, we don’t actually export the spans themselves anywhere, we export the logs. Spans simply decorate those log lines with additional data. Also, just like OTEL spans, spans can be nested one under the other and the log lines will be decorated by all the spans they are nested under. This simple code-snippet will be easier to understand than a wall of text:
Just like with OTEL spans, when we create a span in some part of the code we call this instrumentalization. The Tracing crate has some nice macros that allow us to create spans for functions easily (to use a more correct term, to allow us to easily instrument a function):
Tracing Subscriber
If we just created spans and logs with the Tracing crate, nothing would happen. Those events need to be captured by a Tracing Subscriber which then decides what to do on each event (for example, print the log to the console, or send it to some log collector using special protocol, or ignore it completely if the log level is not sufficient). There’s a number of different implementations of Tracing Subscriber available in different crates and there’s more information in official docs. We’re just interested in an implementation that comes with the default Tracing Subscriber crate, which is called Registry and it is an implementation of Tracing Subscriber that handles a lot of boilerplate code needed to write a subscriber and allows us to plug in layers which will be called on different events (span created, span exited, log line created, etc.).
TLDR - when an event (span or log related) is created by the Tracing ecosystem, Registry (an implementation of the Tracing Subscriber trait) will capture it and allow us to add custom logic to respond to this event if we want to.
Correspondence between the Tracing crate and OTEL Tracing
The fact that Tracing and OTEL Tracing both use the terms spans and instrumentalization is not a coincidence. When you think about it, spans (Rust Tracing spans we open to add context to logs) and OTEL spans (spans we export to the Trace Collector to visually inspect the execution of our code) are rather similar.
In both cases, we instrument a part of our code, which means we:
take a part of our code
give it a name
assign some values
with the Tracing crate in order to add context to logs
with OTEL Tracing in order to add context to spans
track when we entered and exited
in the Tracing crate in order to know when we need to add this span context to some logs
in OTEL Tracing so that we can let Trace Collector know when each span started and ended
So, the obvious question is, could we somehow use the Rust Tracing spans (which we create to add context to our logs) for OTEL Tracing purposes?
Hopefully, you guessed that this entire blog post wouldn’t make much sense if the answer was no.
Let’s go back to the examples we gave for logging with the Tracing crate:
If we managed to use Tracing spans as OTEL spans, we would expect that snipped to generate something similar to this in our Trace Explorer:
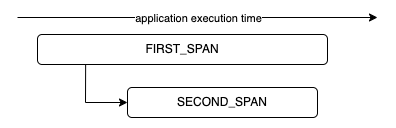
FIRST_SPAN is the first step of our execution logic, after a while (in the FIRST_SPAN) we start the SECOND_SPAN as a child of the first one, then SECOND_SPAN completes execution and immediately after that the FIRST_SPAN completes as well.
Or for the approach where we annotate the entire function:
We expect to find a trace like this:

Conclusion
I hope that by this point you see the potential we have with this approach.
Odds are we will need to configure the logging in our application anyway, and we can get detailed traces of our application execution for free by properly configuring our code to convert all the Rust Tracing spans to OTEL spans and export them to our Trace Collector.
In the next part we start writing the actual code.
Comments