
Setting up Tracing and OpenTelemetry with Jaeger for a Rust Actix Web application
- Ivan Brko
- Jan 13, 2024
- 7 min read
This is the second post in the Rust/Tokio/Tracing/OTEL tutorial series.
In the previous post, we gave an Introduction to Tokio Tracing and OpenTelemetry. In this post, we'll write the code for our application to export structured logs and OTEL spans (to Jaeger) using the Tokio Tracing crate and OpenTelemetry.
In the next post, we'll change the code to export traces and logs to GCP instead.
The code for this tutorial can be found in https://github.com/ivan-brko/rust-tracing-otel-tutorial.
Getting started with the code
Now, let’s finally write some code!
For all the examples in this blog post it will be enough to create a simple web application that exposes a single endpoint, so let’s do just that.
Also, we'll be using the popular Actix Web framework to write our web application.
Basic application
We’ll take the Hello World example from the Actix Web homepage and expand it with a couple of functions that do nothing but sleep, just to have a more interesting call stack to trace later. Also, we’re using Tokio as the async runtime, because we’ll be using other crates from the Tokio ecosystem (like Tracing).
This is the Cargo.toml needed to start our project:
And then we have our main.rs:
and last, also in the /src directory, request_handling_logic.rs:
The project should compile, and if you send a GET request to localhost:8080/hello/<YOUR_NAME> you should get a response like this:
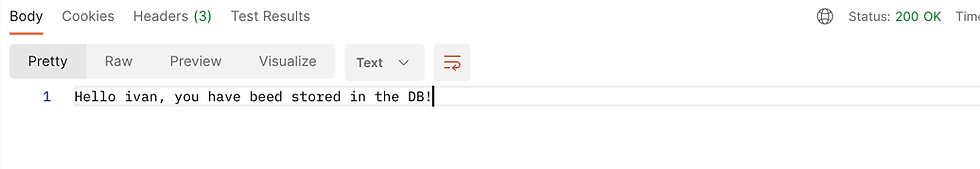
If some of the code is not clear, check the Actix Web documentation.
Adding basic logs with Tracing Crate
The first thing we want to do is add some basic logs to our application.
As already described in the previous post of this series, we need to:
instrument our code (add spans that add more context to logs)
add log lines in our code
add a tracing subscriber that will collect all the events from the previous two steps
Let's first add dependencies for tracing and tracing-subscriber to our Cargo.toml.
Notice that we added some features to our tracing-subscriber crate:
fmt → allows us to print logs in a more human-readable way, you would use that while running the application locally
env-filter → allows us to configure the minimal log level we want to collect with environment variables (for example, we can set export RUST_LOG=info and we won't see any logs of a lower level than info)
json → allows us to print logs as json, this is usually used when exporting structured logs to some log collector tool (I will show how to configure json logs, but we will not use them later in the code), so you can skip this feature flag if you don't want to use it
Now, we’ll also add a new file called init.rs in the /src directory and add the code to initialize our tracing subscriber there:
This code will initialize a tracing subscriber with the fmt feature flag we included, we’ll set the env_filter to read the default environment variables (RUST_LOG) and set the log output to pretty. This is a human-readable log output that you would use locally (If we wanted to print json logs, we would just replace .pretty() with .json()).
This code does the following:
initializes a tracing subscriber with the fmt feature flag we included
sets the env_filter to read the default environment variables (RUST_LOG)
sets the log output to pretty (human-readable log output that you would use locally, if we wanted to print JSON logs, we would just replace .pretty() with .json()).
Call to .init() will install this trace subscriber we just created as a global default, which means that all the events emitted by our tracing crate will be collected by this subscriber. It’s important to notice that you are only allowed to install a global tracing subscriber once in your application, or you will get a runtime error.
By default, our subscriber will print all the logs to the console.
Now, in our main.rs we have to install this subscriber before starting our web application. Also, we’re logging when our application starts and when it shuts down.
Last, but not least, let’s print some logs in our functions that handle our business logic for incoming requests. Again, nothing fancy, we add the #[instrument] annotation over functions which creates a span for each function and we print whenever we enter and exit a function:
Before running the application, make sure that RUST_LOG env variable is set, for example by running export RUST_LOG=info.
As soon as you run the application, you should see some logs events that are emitted by Actix Web and collected by our subscriber (also the log we added when the application is starting).

When we send a new request, we should see all the logs we added to our business logic:

Notice the following from the log line Storing to DB (we’re just using that line as an example, the following applies for other log lines):
we annotated two of our functions (store_to_db and inner_greet) with #[instrument] and they automatically had their spans created (also, their function parameters got added to spans as well). If you remove #[instrument] from one of the functions, you will see that reflected in the log context of these logs.
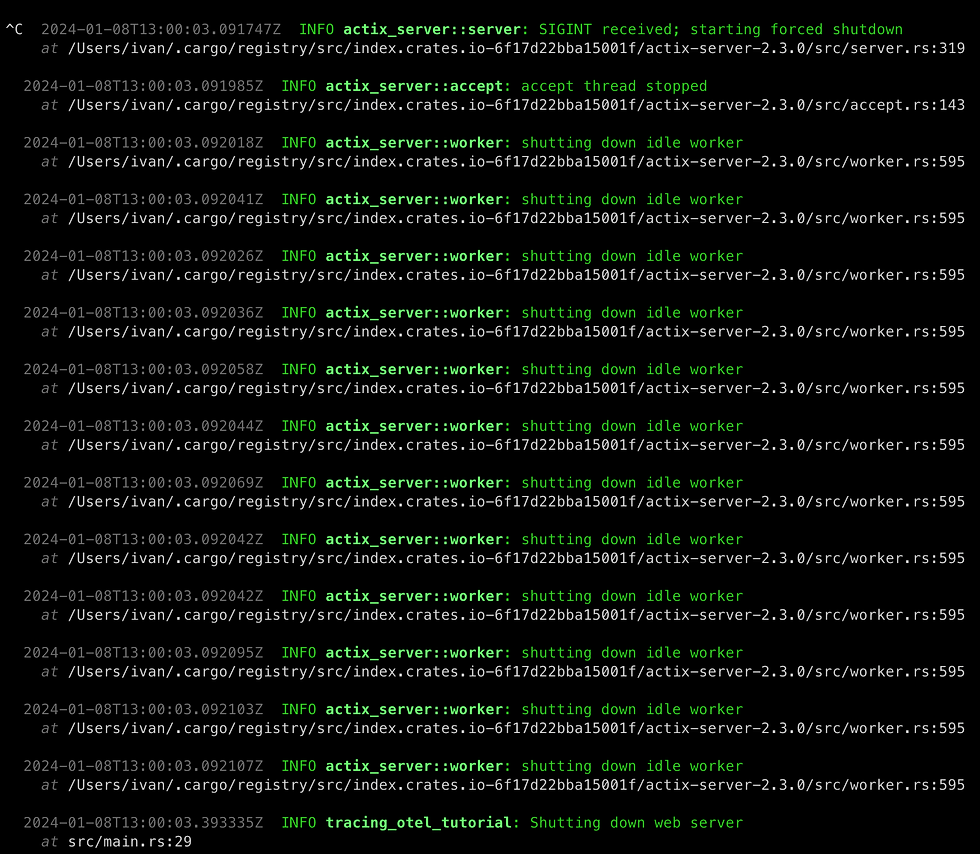
Once we shut down the application, we can see logs by Actix Web and the one we added on application shutdown:
Adding more information to our spans
As both Tracing and Actix Web are very popular, there’s a lot of other crates available in their ecosystem.
One of these is https://crates.io/crates/tracing-actix-web, and it will create a root span with some additional data for each request, thus providing more information in our log context for each log generated while processing that request (it will also help us with some other stuff related to OpenTelemetry, but more on that later).
We don’t have to change much, just add a new dependency to our Cargo.toml:
and add one line to our main.rs to activate the tracing-actix-web middleware:
Start the application, send a request and you should see log entries like the following:
Notice that the middleware we included has created a root span for our request, with a lot of information about the request itself and a randomly generated unique request id which will allow us to track all the logs for this request easily.
Exporting the OTEL traces to Jaeger
As we wrote earlier, our goal is to convert our Tracing spans to OTEL spans and then export those to some Trace Collector.
While testing locally, we’ll export them to Jaeger and in the next post I’ll show how to export them to GCP Trace Explorer.
Let’s first run Jaeger locally.
Save this file as docker-compose.yaml in the root of your application and run docker-compose up -d:
Now, if you navigate to http://localhost:16686/ you should see the Jaeger GUI, something like this:

We have no traces yet, so we can’t see anything interesting, but let’s do something about that.
Once again, the popularity of Tracing ecosystem works in our favour, as most of the work needed to convert Tracing spans to OTEL spans is already done and we just have to use the libraries.
First, let’s edit our Cargo.toml:
We added 4 new dependencies, they are needed to:
work with OpenTelemetry
export OTEL spans to Jaeger
convert Tracing spans to OTEL spans
We need to change our init.rs file to add a Jaeger exporter and plug that exporter into the Tracing pipeline, so that we create new OTEL span on each Tracing span.
This is the new init.rs:
The entire file is different from what we had before, let’s unpack the changes:
We create the Registry Trace Subscriber, which was already explained earlier in the tutorial. Basically, it is a Trace Subscriber that allows us register additional middleware that will be triggered on Tracing events (log lines, spans…)
first registered layer is the same thing we had before, we want to be able to configure the logger with environment variables
second registered layer is the OTEL layer, and more on that in the following bullet point
third layer is, again, the same thing we had before, we want to have pretty (human-readable) log output
construct_open_telemetry_layer() is a function that:
installs our global Jaeger exporter which exports all the OTEL traces to Jaeger
returns that layer so that we can use it with our Registry Trace Subscriber to trigger new OTEL spans on new Tracing spans
That’s all the changes needed. Now, if you restart the application and send a new request, you should see traces in Jaeger GUI.
In the init.rs code we named our service Example Application, so make sure to select that service and click Find Traces:

You should see the list of all traces, one for each request you sent after configuring the Jaeger export:
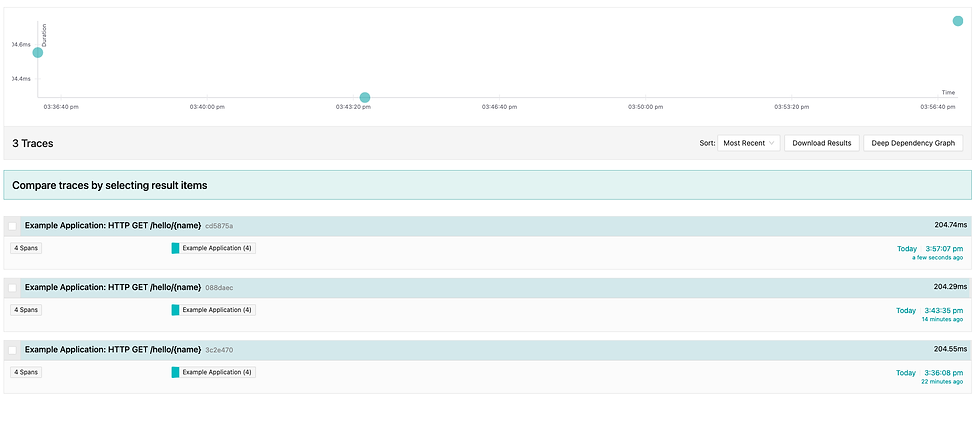
If you click on any of the traces, you will see more details and you can notice that the steps for our trace exactly match the spans we have created in our logs using the #[instrument] attribute:

Also notice that our logs are exported as well and that steps last exactly as much as we would expect them, given the sleeps we configured in the code.
Propagating the trace context, incoming requests
We already mentioned earlier in the tutorial that we want to propagate the trace context between microservices.
This tutorial focuses only on propagation with W3C Trace Context standard.
First, we need to add the feature flag to our tracing-actix-web dependency, which will allow us to get the OTEL context from an incoming request and store it in our OTEL context (our OTEL context is actually stored as additional metadata for our Tracing Context).
Our new Cargo.toml:
And just a minor change is needed in our init.rs:
Now, restart the application and send the request again and let’s also add the header traceparent and set it to something like 00-f6613a397e4db26631df78bf28d94974-e075ac2678ca9eb6-01 (in the previous post there is an explanation of this format).
If you check the Jaeger GUI, you should see that our latest trace has trace id f6613a397e4db26631df78bf28d94974 and that we have a warning about the parent span id. This is expected as the root span of our application reported that it has a parent span with id e075ac2678ca9eb6 (the ID we sent in the header) but nobody ever reported that span id to Jaeger. In a real-world scenario, where the microservice that’s calling us would export its traces to Jaeger, we wouldn’t have this issue.

Propagating the trace context, outgoing requests
Just as we want to be able to read the trace and span ids from incoming requests, we want to be able to propagate them to the microservices that we call. Unfortunately, reqwest-middleware (Rust go-to HTTP Client library) PR for support for OTEL versions we are using in this tutorial is still not merged (Pull Request #112), so this tutorial will be updated once a new version of that library is released with this PR included.
For now, temporary workaround is to use the following code to retrieve trace_id, span_id and is_sampled and to construct the W3C Trace Context header as described earlier in the tutorial:
Conclusion
And that is it, we used the Tracing library in combination with OTEL to export rich logs and traces from our web application! The last post in the series will discuss how to change our code to export logs and traces when running in GCP.
Comments